
VISUAL ANALYTICS – DELIVERING ACTIONABLE SECURITY INTELLIGENCE
BlackHat 2015 - Las Vegas
Big Data is Getting Bigger - Visualization is Getting Easier - Learn How!
Dates: AUGUST 1,2 & 3,4
Location: Las Vegas, USA
SIGN UP NOW
OVERVIEW
Big data and security intelligence are the two very hot topics in security. We are collecting more and more information from both the infrastructure, but increasingly also directly from our applications. This vast amount of data gets increasingly hard to understand. Terms like map reduce, hadoop, spark, elasticsearch, data science, etc. are part of many discussions. But what are those technologies and techniques? And what do they have to do with security analytics/intelligence? We will see that none of these technologies are sufficient in our quest to defend our networks and information. Data visualization is the only approach that scales to the ever changing threat landscape and infrastructure configurations. Using big data visualization techniques, you uncover hidden patterns of data, identify emerging vulnerabilities and attacks, and respond decisively with countermeasures that are far more likely to succeed than conventional methods. Something that is increasingly referred to as hunting. The attendees will learn about log analysis, big data, information visualization, data sources for IT security, and learn how to generate visual representations of IT data. The training is filled with hands-on exercises utilizing the DAVIX 2014 live CD.
What's New?
The workshop has undergone quite some updates. Here are some highlights:
- A general overhaul of the data source section with a focus on calling out pitfalls and lesser known features of different sources. It also finally features the topic of threat feeds as an important data source.
- The log processing section now covers the CSVKit to help process data on the command line. SQL on CSV files anyone?
- Log management has been tightened up to contain the basics of log management and SIEM. The ELK Stack and Moloch are two tools we look at in depth .
- The discussion of LogStash has expanded with more information on how to run it, example configurations, and an in-depth exercise where we even use the LogStash APIs to query data via REST
- Big Data has gotten a revamp to a more up to date version with all the things that happened in the last year. This section discusses the new concept of the bid data lake for security also.
- If there is time and the class is interested, we will embark on a quick journey into data science with R, where we also run through an exercise.
- The visualization part has undergone some reorganization. Previously, visualization tools and visualization were separate sections. Now they are much more mixed and the visualization section itself has many more security examples to drive the concepts home.
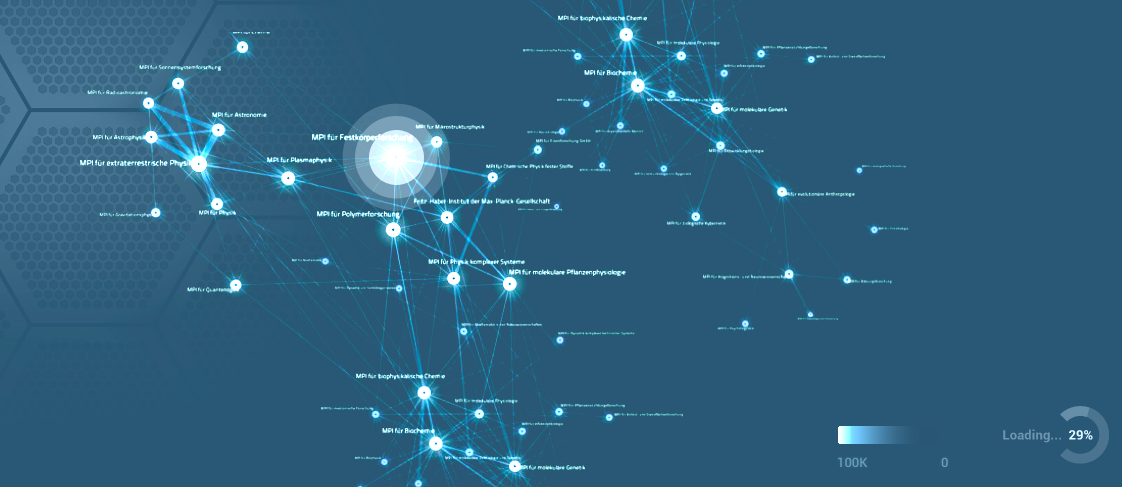
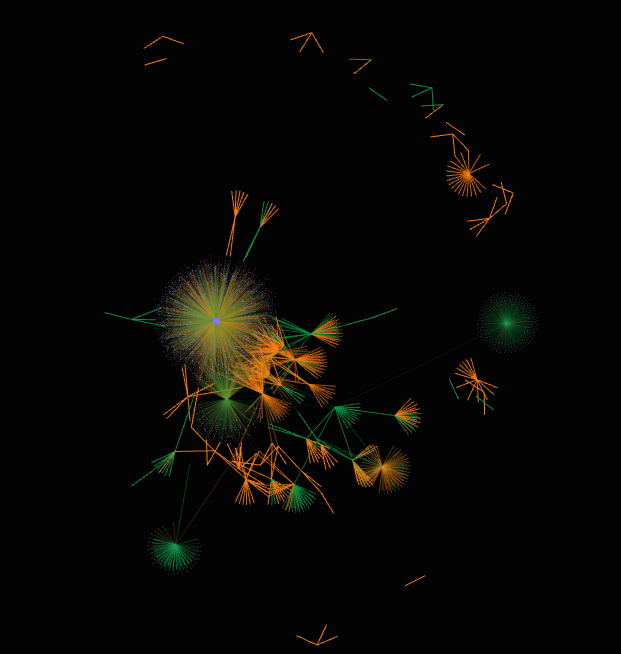
- One of the visualization tools, Gephi is discussed in depth and we show how to go through a network traffic analysis, which will also show the short comings that many visualization tools have.
- When talking about dashboards, we will also look at the topic of the SOC dashboard.
- And finally the security visualization use-cases across the training have been increased in volume and detail. Have you tried to use an inverse count treemap for IDS signature tuning?
SYLLABUS
Day 1:
Log Analysis
- Data Sources Discussion such as PCAP, Firewall, IDS, Threat Feeds, etc.
- Data Analysis and Visualization Linux (DAVIX)
- Log Data Processing (CSVKit, ...)
Log Management and SIEM
- Log Management and SIEM Overview
- LogStash (ELK Stack) and Moloch
- Big Data - Hadoop, Spark, ElasticSearch, Hive, Impala
Day 2:
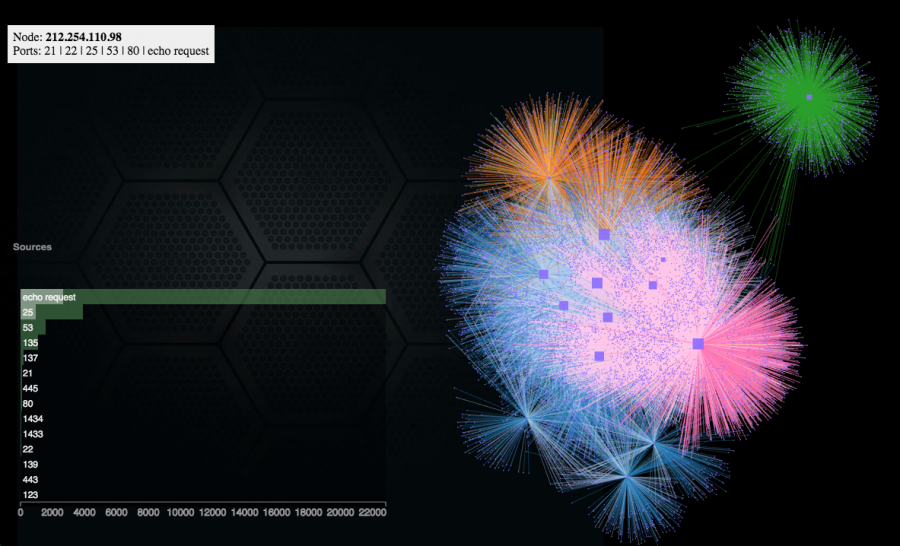
Visualization
- Information Visualization History
- Visualization Theory
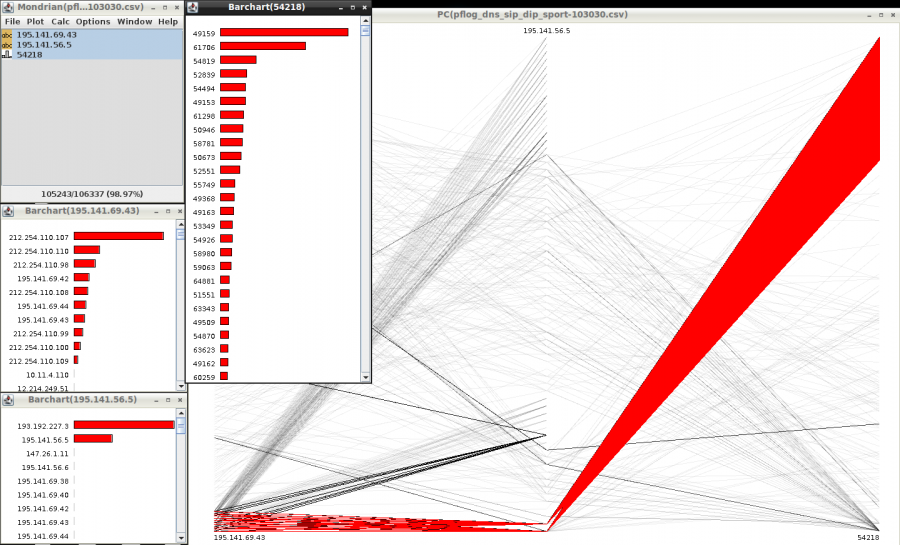
- Data Visualization Tools and Libraries (e.g., Mondrian, Gephi, AfterGlow, Graphiti)
- Visualization Resources
Security Visualization Use-Cases
- Perimeter Threat
- Network Flow Analysis
- Firewall Visualization
- IDS/IPS Signature Analysis
- Vulnerability Scans
- Proxy Data
- User Activity
- Host-based Data Analysis
Sample of Tools and Techniques
Tools to gather data:
- argus, nfdump, nfsen, and silk to process traffic flows
- snort, bro, suricata as intrusion detection systems
- p0f, npad for passive network analysis
- iptables, pf, pix as examples of firewalls
- OSSEC, collectd, graphite for host data
We are also using a number of visualization tools to analyze example data in the labs:
- graphviz, tulip, cytoscape, and gephi
- afterglow
- treemap
- mondrian, ggobi
Under the log management section, we are going to discuss:
- rsyslog, syslog-ng, nxlog
- logstash as part of the ELK stack, moloch
- commercial log management and SIEM solutions
The section on big data is covering the following:
- hadoop (HDFS, map-reduce, HBase, Hive, Impala, Zookeper)
- search engines like: elastic search, Solr
- key-value stores like MongoDB, Cassandra, etc.
- OLAP and OLTP
- The Spark ecosystem
TRAINER
Raffael Marty is one of the world's most recognized authorities on security data analytics and visualization. Raffy is the founder and CEO of pixlcloud, a next generation visual analytics platform. With a track record at companies including IBM Research and ArcSight, he is thoroughly familiar with established practices and emerging trends in big data analytics. He has served as Chief Security Strategist with Splunk and was a co-founder of Loggly, a cloud-based log management solution. Author of Applied Security Visualization and frequent speaker at academic and industry events, Raffy is a leading thinker and advocate of visualization for unlocking data insights. For more than 14 years, Raffy has worked in the security and log management space to help Fortune 500 companies defend themselves against sophisticated adversaries and has trained organizations around the world in the art of data visualization for security. Zen meditation has become an important part of Raffy's life, sometimes leading to insights not in data but in life.