R Project is an open-source software for statistical computing. It is a very comprehensive suite and offers many 2D and 3D visualizations. Data can easily be imported from file or even database.
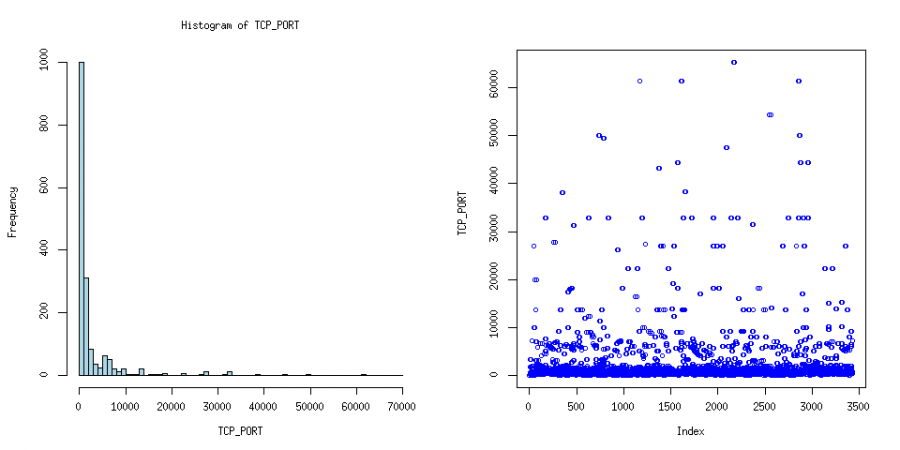
The histogram shows the distribution of the scanned TCP ports when using nmap in default mode against one target system. The other plot shows the order of the TCP ports being scanned. We can see that the ports are scanned rather randomly and not in sequence as one might expect. The data for the visualization was extracted using tshark, the command line version of Wireshark.
The plots where generated with following commands:
root@davix:~/# tshark -r nmap_option_v_oA.cap -Tfields -Eseparator=, -R "ip.dst == 192.168.119.135 and tcp" -e tcp.dstport | sort -n | uniq > tcp_ports_sorted.csv
root@davix:~/# tshark -r nmap_option_v_oA.cap -Tfields -Eseparator=, -R "ip.dst == 192.168.119.135 and tcp" -e tcp.dstport > tcp_ports_unsorted.csv
root@davix:~/# R
R version 2.6.1 (2007-11-26)
Copyright (C) 2007 The R Foundation for Statistical Computing
...
> results <- read.csv("tcp_ports_sorted.csv", header=T);
> attach(results);
> names(results);
> png(filename="tcp_port_histogram.png");
> hist(TCP_PORT, freq=TRUE, col="lightblue", breaks=seq(from=0, to=70000, by=1000));
> dev.off();
...
> results <- read.csv("tcp_ports_unsorted.csv", header=T);
> attach(results);
> names(results);
> png(filename="tcp_port_over_time.png");
> plot(TCP_PORT, col="blue");
> dev.off();
> q();
If you are looking for a quick and easy introduction I recommend looking at the first three chapters in Jane Horgan's book "Probability with R: An Introduction with Computer Science Applications".

