Hi folks,
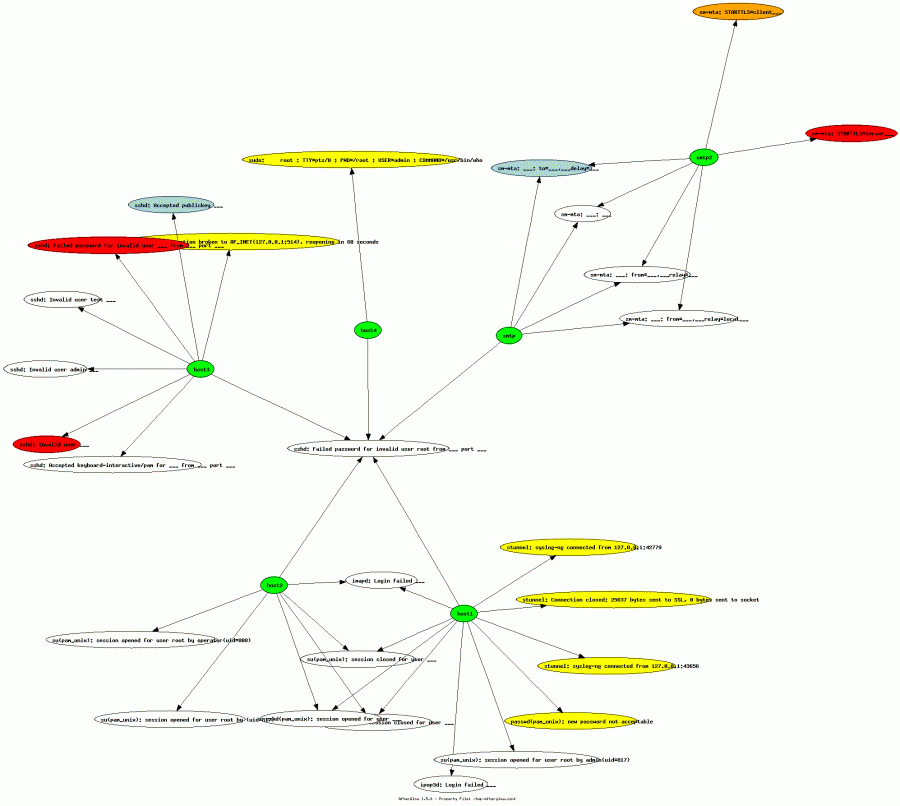
I wanted to see if I could hook up Tenshi, a log monitoring application, with some pretty graph, for a long time. The current tree supports a csv output feature that allows pipeing to something like AfterGlow.
In order to get this you can use something like this in your tenshi configuration (if you use the latest version from the tree):
set csv [0 * * * *] /usr/local/bin/tenshi_graph.sh
Where tenshi_graph.sh could be
#!/bin/sh
/usr/local/bin/afterglow.pl -c /etc/afterglow.conf -t | neato -v -Tpng -o /var/lib/tenshi/tenshi_graph.png
and afterglow.conf configuration could be something like
color.source="green";
color.target="red" if ($fields[2] > 1000);
color.target="orange" if ($fields[2] > 500);
color.target="blue" if ($fields[2] > 100);
color.target="lightblue" if ($fields[2] > 50);
color.target="yellow" if ($fields[2] == 1);
color.target="white";
This allows having target node colours depending on the number of hits of the affected log, but of course it might be whatever conditions you want. You can see how it's possible to quickly evaluate logs that are common to different servers and their frequency.
Keep in mind that in order to have useful and readable graphs your tenshi configuration must be accordingly tuned. Arbitrary logs in the csv queue would quickly generate huge and unreadable node maps.
This is just an example, more advanced processing can be done. If you have new ideas please share them on tenshi-user@lists.inversepath.com mailing list and/or the SecViz portal :).
Cheers!
Andrea Barisani
andrea@inversepath.com

