

click here for the full picture
The effectiveness of intrusion detection systems, which apply misuse detection, strongly depends on the conciseness and topicality of the applied signatures. Imprecise signatures heavily limit the detection capabilities of the intrusion detection systems and lead to false positives. The reasons for this detection inaccuracy can only to a lesser extent be imputed to qualitative restrictions of the audit functions. Instead, these restrictions must be identified primarily in the signature derivation process itself.
In particular, the derivation of signatures starting from given exploits appears to be a very complex task, which comprises identifying the traces in the audit data that are left behind by an attack and determining characteristic relations of the attack. This procedure requires also a manual audit data analysis. Admittedly, this basic activity is time-consuming, sophisticated, and cumbersome. The main reasons for these difficulties are the flood of very fine-granular information distributed to different sources as well as the non-ergonomic inspection of audit data.
Consequently, abstraction capabilities to extract relevant parts of this data richness are crucial, but common tools for audit data analysis do not tackle this issue. Abstractions, i.e. the goal-oriented accentuation of relevant relations between audit events, while concurrently hiding irrelevant data are a key aspect to support the security officer during audit data analysis. Another key aspect impacting the time requirements of the analysis is the representation of the data to be analyzed. Typically, a textual representation of audit data is used, which only inadequately allows to illustrate relations between audit events and thus is suboptimal for providing a holistic view on system behavior. Unclearly arranged representations are irritating and lead to wrong assessments and conclusions. These drawbacks can be remedied by using a graphical multi-dimensional representation of audit events.
We developed the tool ADO for three-dimensional representation of audit data that can be explored interactively. The user can create arbitrary views on the data and can study and visualize relations or dependencies of the data. Furthermore, the tool ADO is a part of the signature development tool, which supports the knowledge transfer from identified attack relevant relations between audit data and the actually signature modeling.
The current version of ADO supports BSM (Solaris Basic Security Module) audit logs as input data. Our ADO tool consists of the three components sensor, the analysis and transformation component, and the presentation component. The sensor transforms BSM audit events into a common data structure and provides the data to the analysis component. The analysis component allows the user to define metrics and to adjust particular abstraction parameters. These settings control the quantitative analysis which is followed by a space-specific transformation. The resulting three-dimensional virtual audit data world is turned over to visualization component, which offers the user visualization and interactive exploration capabilities.
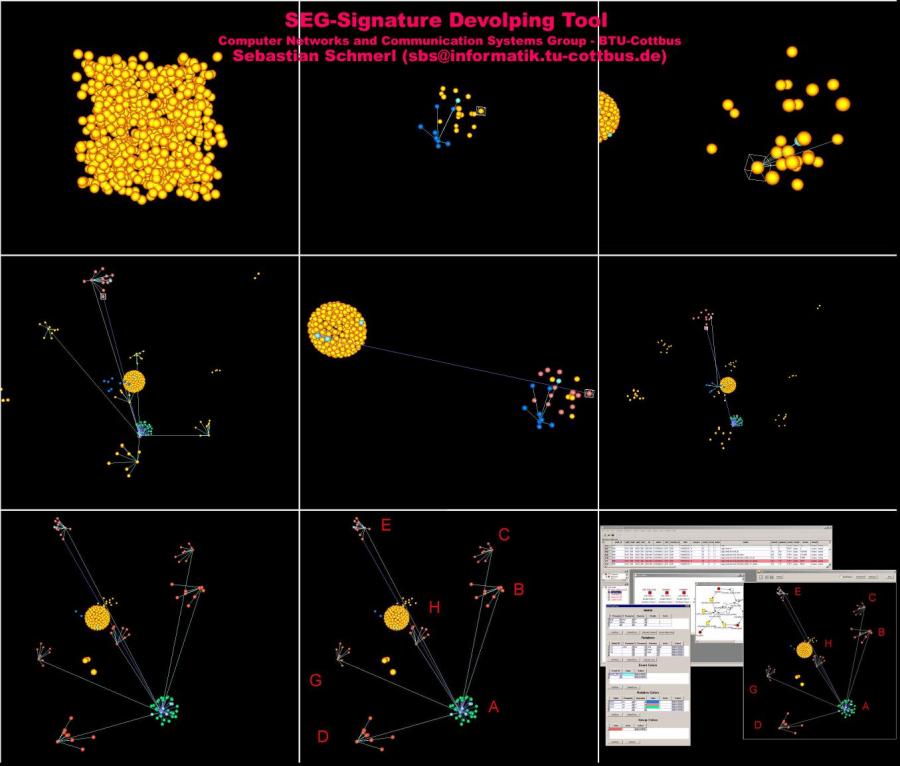
The picture shows the single stages of an exploration of an attack on a Solaris system by using ADO. Starting from the picture in the upper left part the signature engineer explores a set of audit events and identifies and visualizes attack relevant relations in these events. The picture in the lower right part shows our SEG-Tool with the audit data visualization tool ADO and the other signature modeling components.